Guest
Ian,
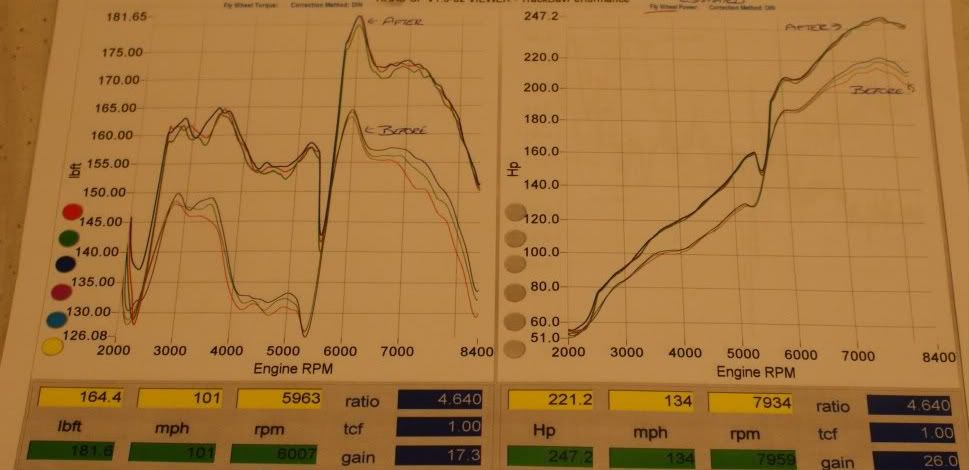
Your Nearly there mate, firstly the graph you are refering to is our 2.3 Race car not the demo. the demo graph was the first map, it was the cam angles causing the dip in torque, as you can see from the later posts of customers cars which have a smooth transition from primary to secondary and vtec lobes.
The power peaks on both our cars are lower than normal because on the race car we use a 2.3 engine which under square and produces high torque 200+ft.lb. the demo car exhaust is a spec 4 which is more restrictive than a Pro Spec, this shows higher torque but slightly lower top end revs,
we can make an engine produce the power or torque characteristics that we want by using different combinations of bore size/stroke length/induction length/cams profiles/valve size/exhaust.
Paul,
")